You just finished a three-page proposal. It’s good. It’s also a wall of text, and you know the client is going to skim it on their phone. The old fix was a detour: copy everything into Canva or Slides, wrestle with a template, export, paste back. Twenty minutes for one picture.
As of July 28, 2026, there’s a shorter path. Google started rolling out visual generation right inside Google Docs — you can now ask Gemini to build an image, a diagram, or a full infographic from your document’s own words, without ever leaving the page. Type a plain-English request, and a one-page visual appears in your doc, built from what you already wrote.
If you’ve ever searched “how to make an infographic in Google Docs” and gotten a bunch of “just use a different app” answers — this is the update that finally changes the answer. Here’s how it works, the exact prompts that do the job, and the one catch that decides whether you can use it today.
What Google actually shipped
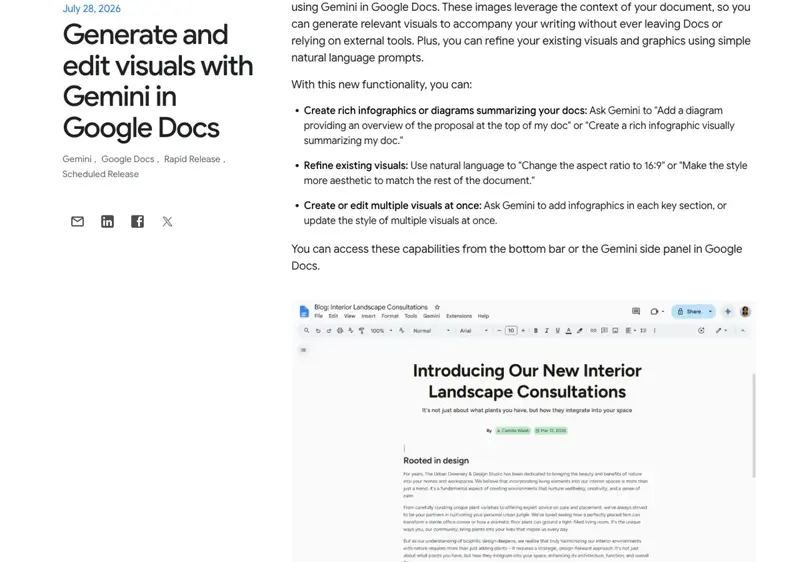
The feature lives inside Docs, in the Gemini side panel or the bar at the bottom of your document. You describe what you want in normal language, and Gemini reads your document to make something that fits — the topic, the tone, even the wording. Google’s own announcement puts it plainly: you can “create and edit images, diagrams, and infographics directly alongside your text.”
The key word is context. This isn’t a blank image generator you have to feed a paragraph of instructions. It already sees your report. So “summarize my doc as an infographic” actually means your doc — your numbers, your headings, your points.
And it’s not one-and-done. You can keep talking to it — change the shape, shift the style, or ask it to drop a visual into every major section of a long document at once.
Image, diagram, or infographic — pick the right word
Gemini makes three different things, and asking for the wrong one is the fastest way to get a result you don’t want. Here’s the plain difference.
The three prompts that actually work
Google shipped example prompts with the feature, and they’re a good template because they’re specific about what, where, and how. Steal these and swap in your own words.
For a diagram (explaining how something works):
“Add a diagram providing an overview of the proposal at the top of my doc.”
Notice it says where — “at the top.” Tell it the spot, or it’ll guess.
For an infographic (the one-page summary):
“Create a rich infographic visually summarizing my doc.”
That’s the money prompt for consultants and coaches. It reads the whole document and hands you a skimmable one-pager.
For fixing the look (once something’s on the page):
“Change the aspect ratio to 16:9.” “Make the style more aesthetic to match the rest of the document.”
This is the part people miss. The first result is a draft, not a final. You talk it into shape — wider, cleaner, matching your colors — instead of starting over. That back-and-forth is where the good version comes from.
One more thing worth knowing: this is a real step up from the image feature Google added to Docs back in April 2026. That one (“Help me create an image”) just made pictures from a prompt. This July update adds document-aware diagrams and infographics, plus the ability to edit what’s already there. April made art. July makes the summary.
What this means for you
If you’re a consultant sending a proposal: this is the fastest way to make your document look like a designer touched it. Write the proposal like you always do, then ask for “a rich infographic summarizing my doc” and drop it on page one. The client gets the gist before they read a word — and you spent 90 seconds, not half an hour in Canva.
If you’re a coach building a welcome packet: turn your onboarding steps into a clean diagram so a new client can see the whole journey at a glance. “Add a diagram of the 5-step coaching process” reads better than a bulleted list, and it makes a plain doc feel like a premium program.
If you run a small business and live in checklists: your standard operating procedures are probably buried in text nobody reads. Ask Gemini to turn an SOP into a diagram, and suddenly the new hire actually follows it. Same document, but now it’s a wall poster instead of a wall of words.
If you’re on nonprofit or admin staff: board reports and grant updates are exactly the kind of thing that needs a one-page visual on top. Write the report, generate an infographic summary, and give your board the skimmable version they actually wanted. No design budget required.
The catch, and when to still open Canva
Before you go looking for the button, the honest limits.
- It’s a paid feature — check your plan first. This is the big one. The rollout covers Business Standard and Plus, Enterprise Standard and Plus, Education Plus, and Google AI Pro or Ultra (plus a couple of education add-ons). Free personal Gmail and free Workspace accounts are not on the list. If you’re on a free account, you won’t see it — that’s not a bug, it’s the tier.
- It’s slow to appear. Even on an eligible plan, Google is rolling it out gradually — up to about 15 days from July 28 for everyone to see it. If it’s not there yet, you’re probably just waiting your turn.
- Web only. It works in Docs in your browser, not the mobile app. You’ll also need “smart features” turned on in your Workspace settings.
- It’s not a design studio. For a fast client handout, it’s great. But if you need tight brand control — exact fonts, your logo placed just so, a polished multi-page layout — Canva still wins. Think of the Docs feature as “good enough to send today,” and Canva as “worth it when the design is the deliverable.”
So the rule of thumb: reach for Gemini-in-Docs when the writing is the point and the visual is a bonus. Reach for Canva when the visual is the point.
The bottom line
For years the answer to “how do I make an infographic in Google Docs” was basically “you don’t — use something else.” As of July 28, 2026, that’s no longer true. If you’re on a paid Google plan, you can turn a finished report into a diagram or a one-page infographic without leaving the document, using nothing but a sentence typed in plain English.
The trick isn’t the feature — it’s knowing how to ask for what you want, which visual to request, and how to refine it. That’s a skill, and it’s exactly the kind of thing our Google Workspace AI course is built to teach: the specific prompts and moves that turn “I have Gemini” into “I actually get good work out of it.” Learn the how, and every doc you write gets a designer for free.
Got an eligible plan? Open your last report, ask Gemini for “a rich infographic summarizing my doc,” and see what comes back. Worst case, you learn the prompt. Best case, your next client thinks you hired a designer.
Sources
- Google Workspace Updates — Generate and edit visuals with Gemini in Google Docs
- Android Authority — Gemini can now make your Google Docs look a lot less boring
- Chrome Unboxed — Gemini can now generate diagrams and infographics directly inside Google Docs